Gold Prices and the S&P 500
Three weekly price charts are shown for analysis:
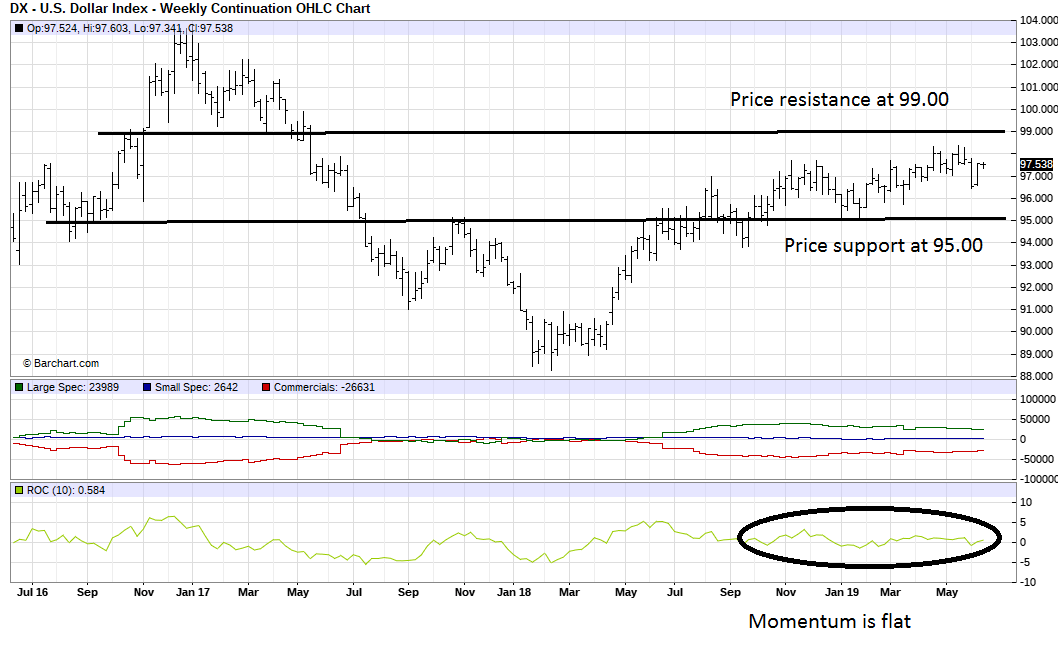
1. US Dollar index (Ticker symbol DXY00)
2. Gold price chart (Ticker symbol GCY00)
3. Gold price chart (Ticker symbol GCY00)
The US dollar index is trading in a range of 95 to 99. The rate of change is flat meaning that price are trading sideways. In the near term price will probably stay within this range.

Despite all the political uncertainty in the world, the gold price is still trading in a range with the lower limit being at $1,280 and the upper limit being $1,360.
Gold price reached a high in March, 2018 at $1,360. That price level has not been breached since then even with all the trade tension between the US and China. For the gold price to move beyond $1,360 a combination of events needs to take place, e.g higher inflation, flare up of hostilities in the mid-east, continued trade friction between USA and China.

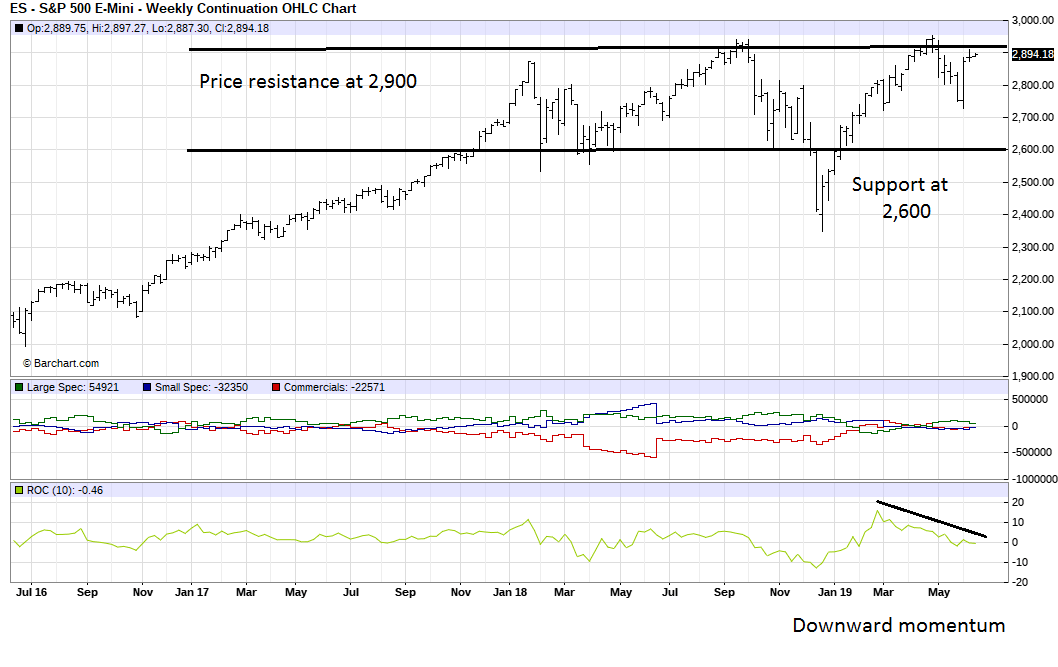
The S&P500 e-mini is also trading in a range of between 2,600 and 2,900. Based on the price movements it looks like prices will struggle to move over the 2,900 mark. Trade policies of the US will hold back stock prices.

To sum up, all three indexes are trading in narrow ranges. Some world event will trigger a breakout from these ranges e.g termination of a trade war with China.
