Convert your gold ETF shares into physical gold- no more paper gold
 Photo: Can Stock
The VanEck Merck Gold Trust (ticker symbol: OUNZ) is a convenient and cost-efficient way to buy gold through an ETF with the option to take physical delivery of gold. Many of the other gold ETFs do not give the investor the option to convert their ETF shares into gold coins or bars.
VanEck Merk Gold Trust holds gold bullion in the form of allocated (segregated) London Bars. The sponsor of the gold ETF is Merck Investment LLC. Merk has developed a proprietary process for the conversion of London Bars into gold coins and bars in denominations investors may desire.
According to the VanEck website: “Taking delivery of gold is not a taxable event as investors merely take possession of what they already own, the gold”
Each investor owns a pro-rata share of the VanEck Merck Gold Trust (OUNZ) and as such holds pro-rata ownership of the Trust’s gold holdings corresponding to the number of shares held.
To facilitate physical delivery of gold, Merck may convert the Trust’s gold into gold of different specifications. Investors may take delivery of one ounce coins and bars. See table below.
| Type | Purity |
|---|---|
| 1 oz American Gold Eagle coins | 91.67% |
| 1 oz American Gold Buffalo coin | 99.99% |
| 1 oz Australian Gold Kangaroo coins | 99.99% |
| 1 oz Canadian Gold Maple Leaf coins | 99.99% |
| 1 oz or 10 oz Australian bars | 99.99% |
For the retail investor OUNZ is a good way to invest in the gold market. ETF shares are purchased in the secondary market and can be redeemed for gold coins or bars at the discretion of the investor. By holding the trust shares, the investor avoids storage costs until such time that he converts to physical gold. Fees apply for the service and can be expensive for small quantities.
OUNZ statistics as at October 13, 2017:
| Total Net Assets | $137.3M |
| Shares Outstanding | 10M |
| Gold in Trust | 105.6M |
| 30-day avg trading volume | 132,096 |
| Exchange | NYSE Arca |
| Options | Available |
| Expense ratio | 0.40% |
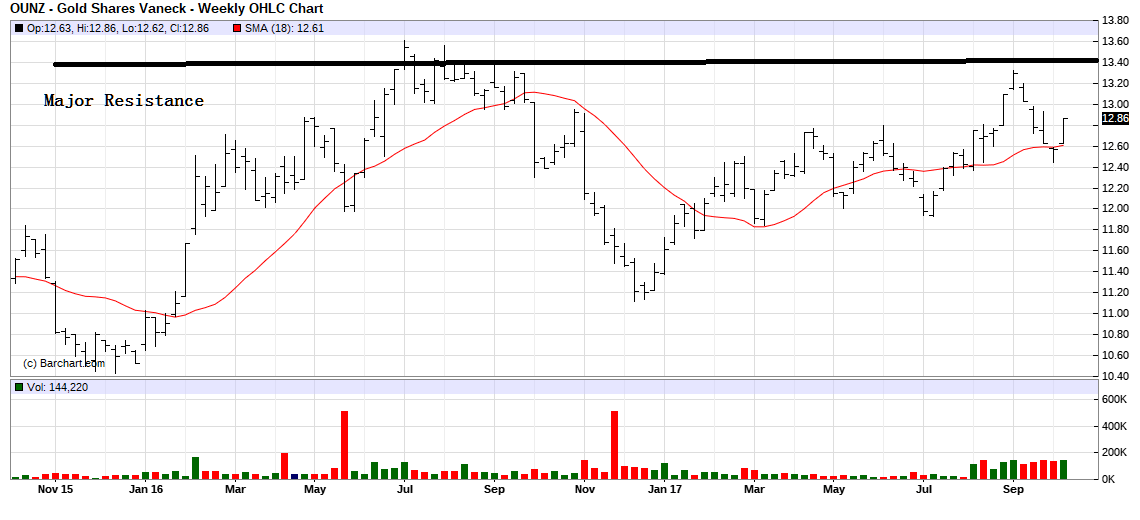
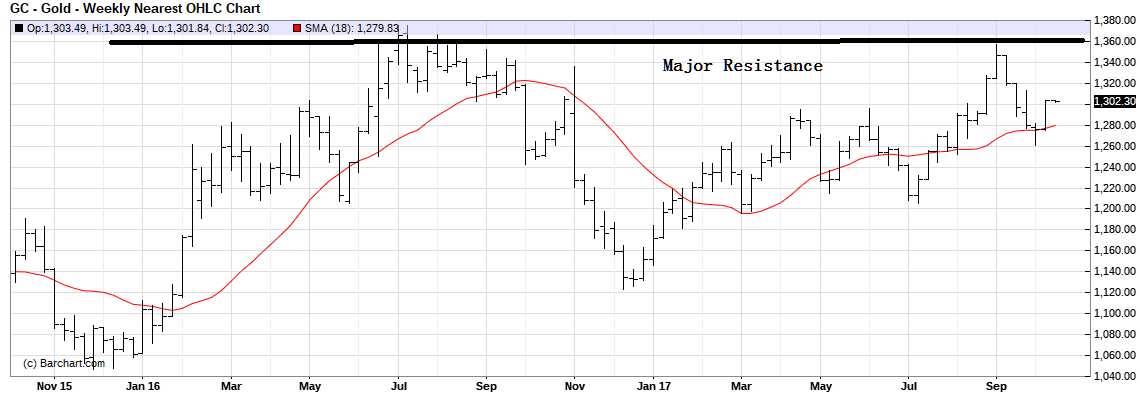
A OUNZ price chart is shown below for WE October 13, 2017. Compare that chart to the cash gold chart shown below it. The price patterns are similar.

Price chart of cash gold for WE October 13, 2017

