Gold and US Dollar Index in trading range
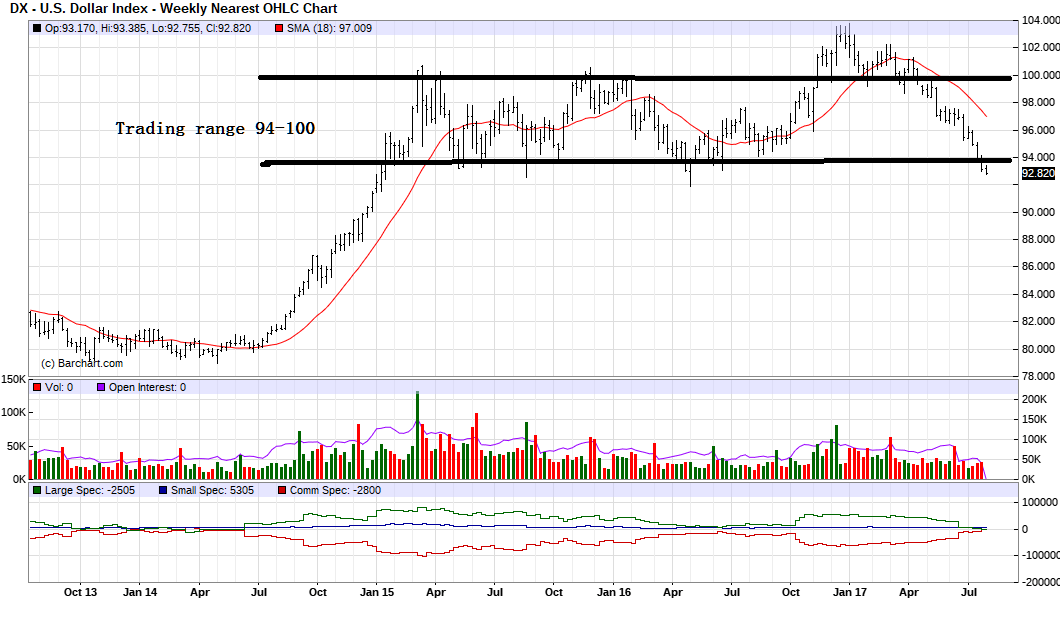
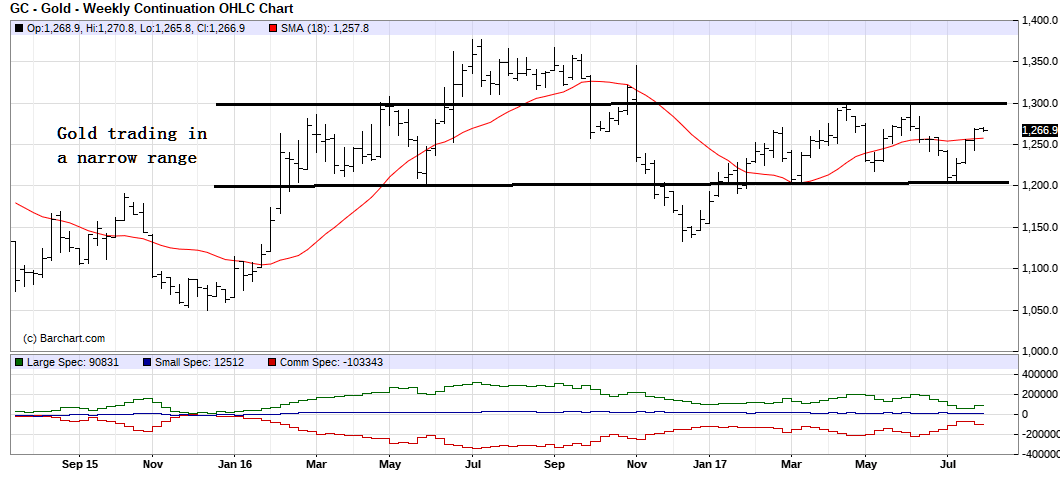
Both the US Dollar Index and Gold are in a trading range. Gold is trading in a $100 trading range from $1,200 to $1,300 from January, 2017 to July, 2017. The US Dollar index is trading between 94 to 100 from about April, 2016 to July 31, 2017.
Weekly US Dollar Index futures chart

The US Dollar Index is trading around the 92 mark as of to-day, July 31, 2017. If it moves below 92 you can expect a bounce back up to the 94. The next line of resistance for the US Dollar Index would be at 88.
Weekly Gold futures chart

IF the US Dollar Index continues to weaken, gold could rise to the $1,300 level which is a major resistance level.
If you are thinking of buying gold for your portfolio, buy at support i.e. around $1,200 an oz. and sell at resistance at $1,300 an oz.
