S&P 500 and Gold – hedge your portfolio against volatility
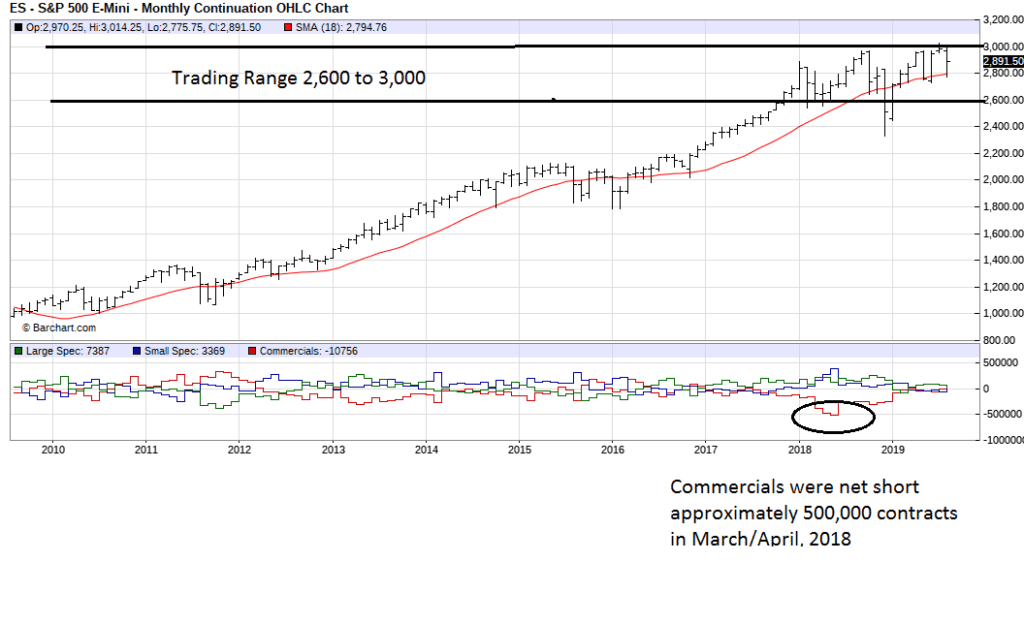
An analysis of the S&P 500 emini futures monthly chart shows that the bull market may be coming to an end. The Commitment of Traders report records the long and short positions of the Commercials ( Hedgers), large speculators (hedge funds, large traders) and small speculators (mainly retail traders). Many people regard the Commercials as smart money. They are normally on the right side of the market be it either long or short. If we look at the S&P 500 emini chart below, the Commercials were net short approximately 500,000 contracts in March/April, 2018. This is largest short position for the past 9 years. This extreme position could signal that the top has been reached or near to the top. From March, 2018 to August, 2019 the S&P500 was in a trading range between 2,600 and 3,000. This is another signal that we could be near the top.

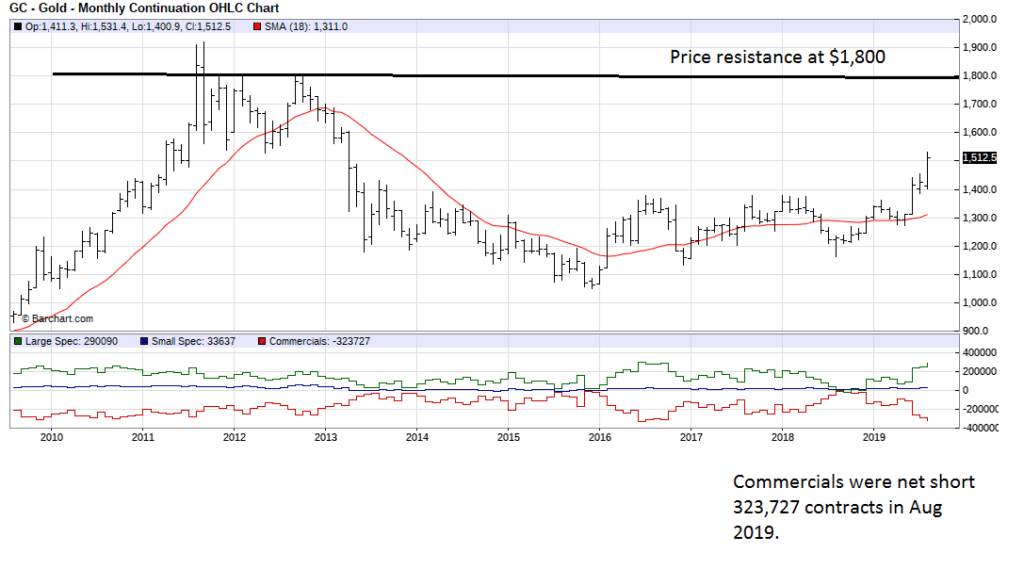
The monthly gold futures chart below indicates that the gold price has a lot of upside. The Commercials were increasing their short positions in June/July/August, 2019. This bodes well for a rising gold price. As the gold price increases relative to the Commercials’ cost of production, Commercials will increase their short position in the futures market as it hedges their cost of production.

Investors can enter the gold market by:
- Buy gold ETFs
- Buy gold mining stocks
- Buy gold jewellery
- Speculate by buying gold futures
